Calculate weighted and unweighted empirical cumulative distributions
Source:R/geom_ecdf.R
geom_ecdf.RdThe empirical cumulative distribution function (ECDF) provides an alternative
visualization of distribution. geom_ecdf() is similar to
ggplot2::stat_ecdf() but it can also calculate weighted ECDFs.
geom_ecdf(
  mapping = NULL,
  data = NULL,
  geom = "step",
  position = "identity",
  ...,
  n = NULL,
  pad = TRUE,
  na.rm = FALSE,
  show.legend = NA,
  inherit.aes = TRUE
)
Arguments
| mapping | Set of aesthetic mappings created by |
|---|---|
| data | The data to be displayed in this layer. There are three options: If A A |
| geom | The geometric object to use display the data |
| position | Position adjustment, either as a string, or the result of a call to a position adjustment function. |
| ... | Other arguments passed on to |
| n | if NULL, do not interpolate. If not NULL, this is the number of points to interpolate with. |
| pad | If |
| na.rm | If |
| show.legend | logical. Should this layer be included in the legends?
|
| inherit.aes | If |
Value
a geom
Aesthetics
In addition to the aesthetics for
ggplot2::stat_ecdf(), geom_ecdf() also accepts:
weights
Examples
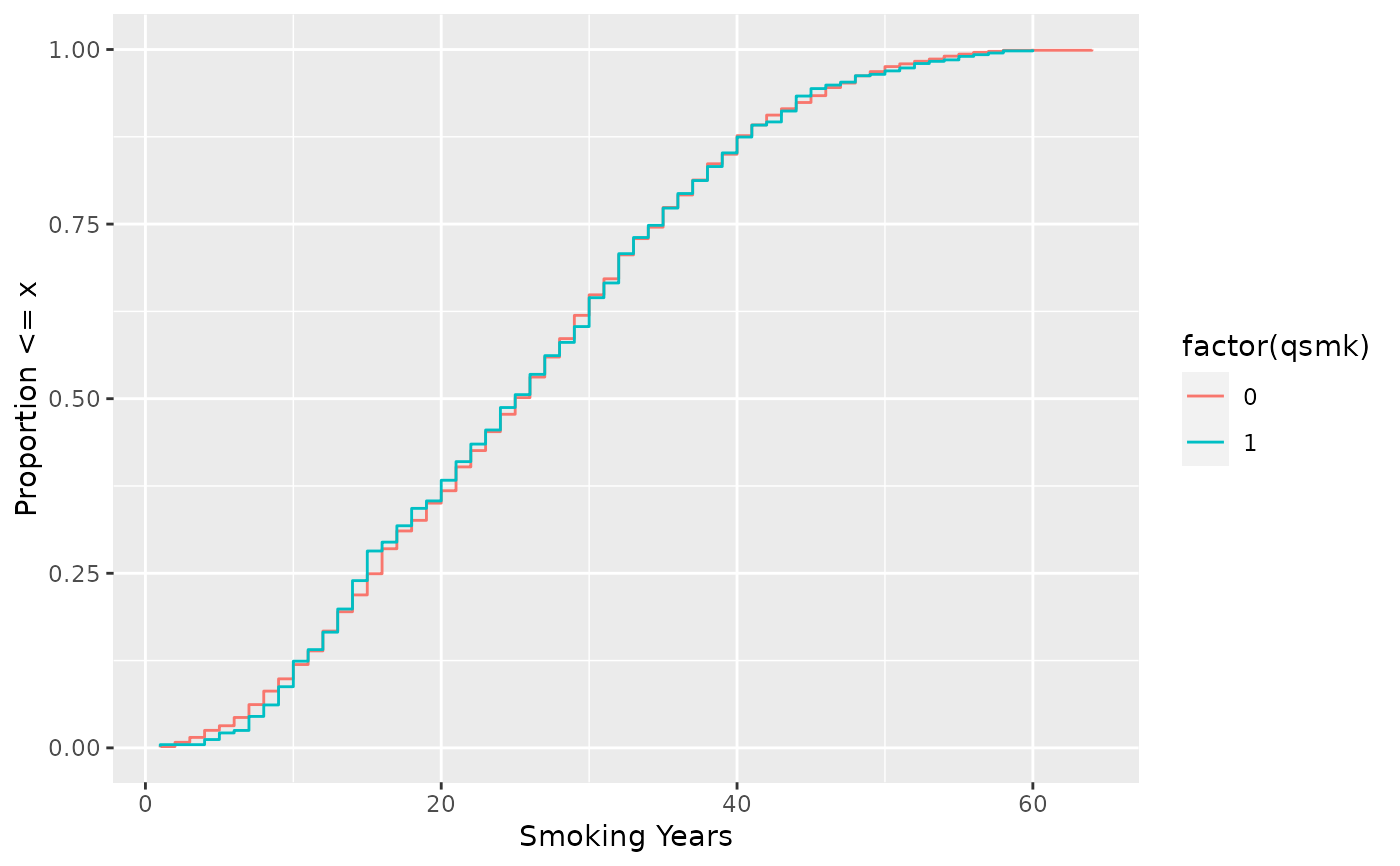
library(ggplot2)
nhefs_weights <- tidysmd::nhefs_weights

ggplot(
  nhefs_weights,
  aes(x = smokeyrs, color = factor(qsmk))
) +
  geom_ecdf(aes(weights = w_ato)) +
  xlab("Smoking Years") +
  ylab("Proportion <= x")