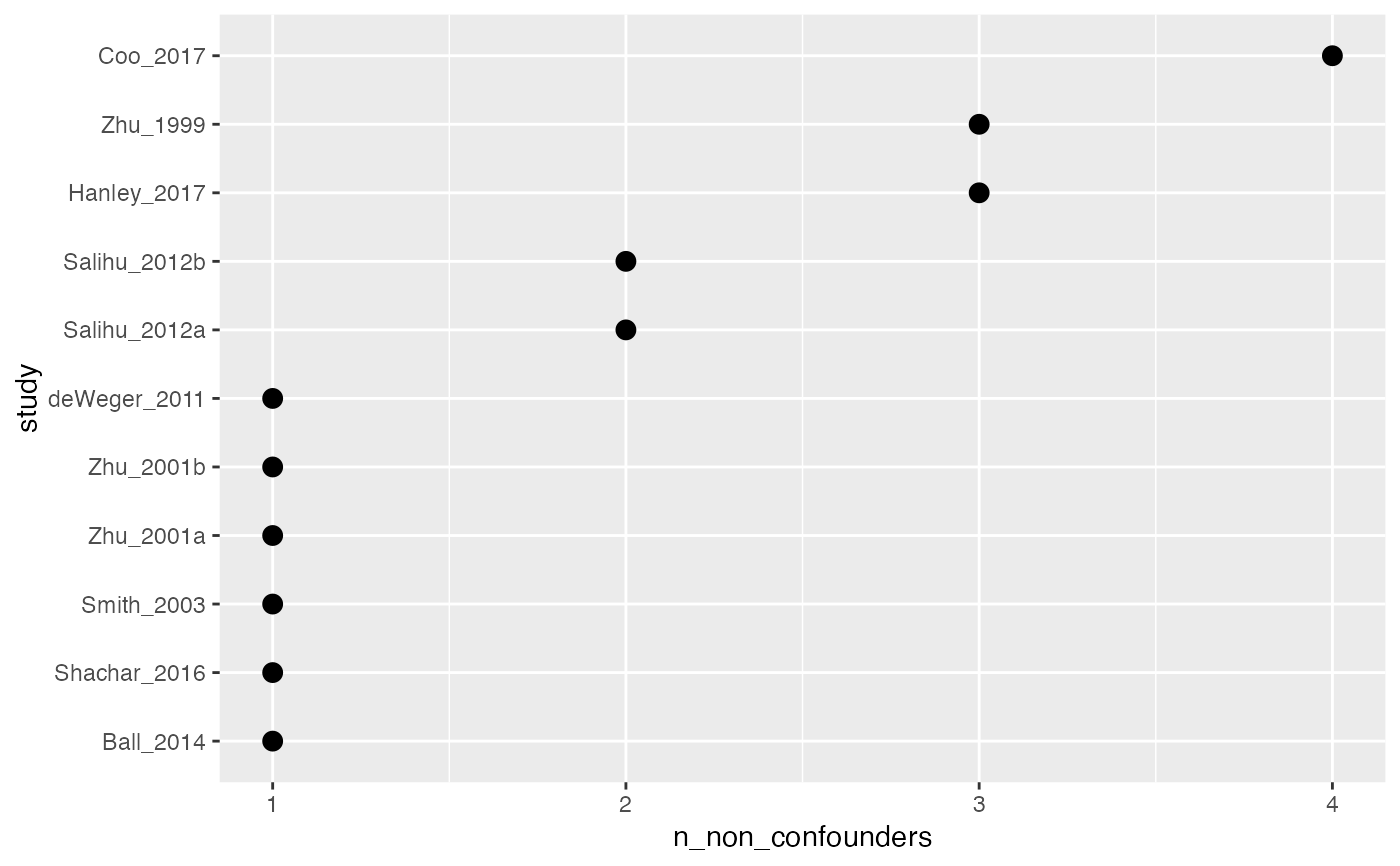
Count and plot non-confounders
count_non_confounders(.df)

plot_non_confounders(.df, ..., geom = ggplot2::geom_col, sort = TRUE)
Arguments
- .df
A data frame, usually the result of
metaconfoundr()- ...
Arguments passed to
geom- geom
The ggplot2 geom to use
- sort
Logical. Should the results be sorted?
Value
a tibble or ggplot
Examples
ipi %>%
  metaconfoundr() %>%
  plot_non_confounders(size = 3, geom = ggplot2::geom_point)
